

Home » Partners + Integrations » Epley’s Athletic Performance Index
Originally developed in the 1960’s by Boyd Epley, MEd, CSCS (the original strength coach); Mike Arthur, CSCS, RSCC*E; and Chris Eskridge, PhD; the Epley Advantage Indexes have been battle tested time and time again.
Once a well kept secret algorithm of elite sports organizations, Dashr is taking the index into the 21st century and is now publicly available!
This Performance Index is the universal language of sport. How do your athletes stack up?
What goes into the report?
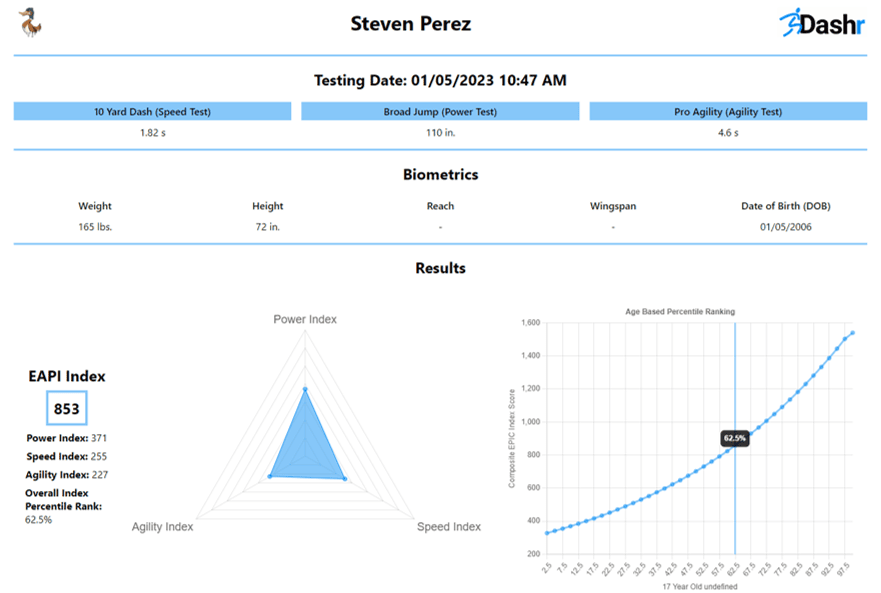
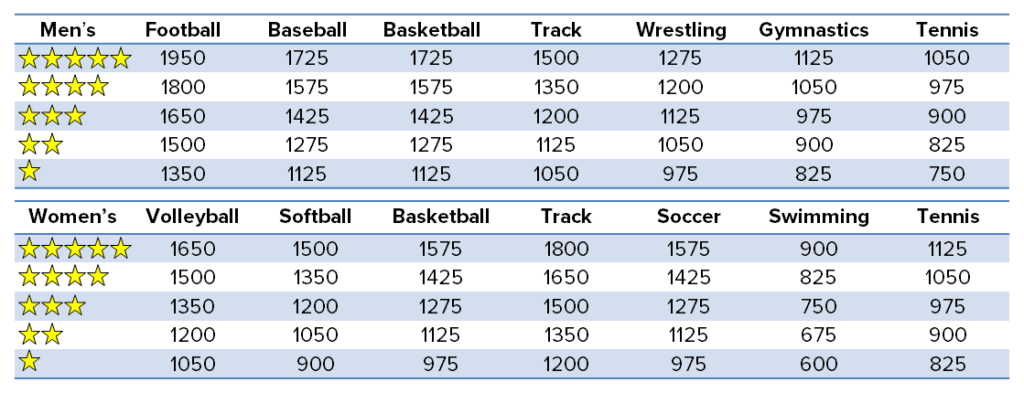
Each performance test (dash, pro-agility, and vertical jump) counts towards your overall score. There is a 5 star system to help you see where you stack up and where you need work when looking to play at the college level. The score required for stars are sport specific. General athleticism is populated in this report.
The Epley Athletic Performance Index (Epley API) consists of Speed, Agility, and Power tests. The 10 yard Dash measures linear speed, the Pro-Agility (5-10-5) measures the ability to change direction and accelerate, and the Broad Jump (Standing Long Jump) is a very good and easy to administer measure of explosive Power.
The Vertical Jump can also be used instead of the Broad Jump.
The Epley API has proven to be a valuable tool for identifying athletic talent and evaluating an athlete’s improvements.
Using the three performance tests along with the size of the athlete, a comprehensive assessment can be generated.
The Index can identify athletic talent for power sports and help coaches determine an athlete’s potential as well as their and progress in training.
The Epley API identifies the athlete’s strengths and points out areas where they can improve.
In addition, it is a great tool for coaches to audit their programming and obtain an unbiased measure of improvement.
The triangle plot is used as a visual to describe the athlete’s strengths and weaknesses in the report.
Athlete 1 – 150 lb male athlete
Epley API – 1170
Athlete 2 – 205 lb male athlete
Epley API – 1241
Athlete 1 had faster times and jumped higher, but even with lower “raw” test scores Athlete 2 achieved a higher Epley API because he is heavier – and therefore is scores are more impressive. If a simple leaderboard was used to present testing results without the Epley API, this may be missed.
Epley ASI is more accurate than any other testing method because it accounts for physical atributes. This allows athletes to compete pound for pound regardless of sport or gender.
For example three athletes are squatting to see who would have the highest Strength Index.
Female Basketball player who weighs – 175 lbs. Squats 300 lbs. for 514 Strength Index points.
Female – Shot Putter who weighs 200 lbs. Squats 320 lbs. for 513 Strength Index points.
While a Male Football player who weighs 250 lbs Squats 540 lbs for 512 Strength Index points.
All three are tremendous athletes to have scored over 500 points. Most high school athletes will be in the 200-to-400-point range.
What goes into the report?